


The idea behind creating the app was to enable its users to leverage high-quality data insights coming from their advanced ground-based turf inspection machine. The client decided to collaborate with Merixstudio knowing us from the previous successful digital products we had delivered for them in the past.


The scope of the work, executed by Merixstudio’s dedicated product team with wide technical project ownership, included:
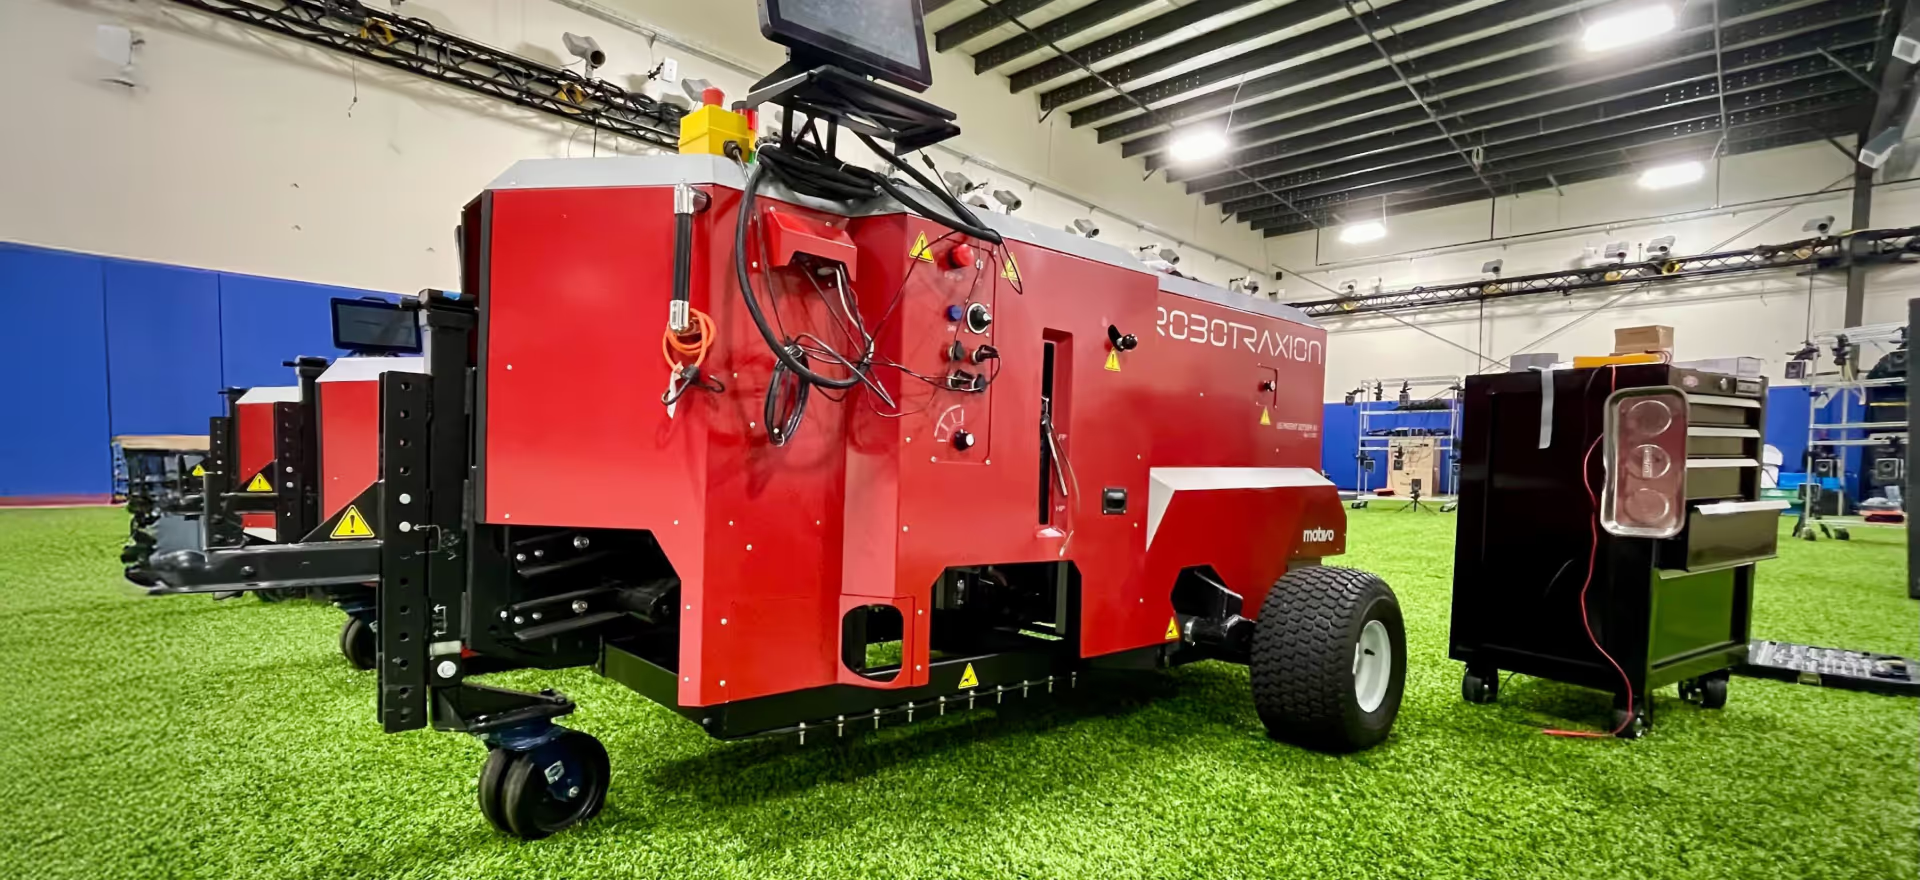
BEAST stands for Biomechanical Elite Athlete Shoe-Turf Tester. The client’s mission is to create high-performing playing surfaces for professional sports play. The main problems troubling the software’s users were manual process flows, slowing down their daily work, and a lack of digital means to address the users’ operational needs. Our task, as a software partner, was to provide a digital solution empowering our target audience with relevant and actionable digitized data insights from the turf inspection machine. The BEAST app addresses this challenge by giving users a tool designed to provide data intelligence.
The client approached us with the input needed to kick off the work. We received the domain information, insights into what the machine looks like, sample charts, and the scope of the data being gathered. We also discussed what the process currently looks like for the Field Managers. We interviewed the users and learned about their work, the obstacles they were experiencing, and the gains they hoped to achieve with this web app. We undertook the challenge of developing an interface for visualizing the data from the machine completely from scratch, based on highly exploratory flows.
With the aim of providing the highest quality, we went for a highly specialized and diverse team of front-end developers, UX and UI designers, and testers led by our Project Manager. The Merixstudio crew of 5 people started our product work with workshops that provided us with the expectations for the product against the business context.
One of the workshops’ main topics was data visualization. We talked a lot about how to show data in a digestible, understandable, and useful way for Field Managers and Researchers. We worked directly with end users during workshops, which proved invaluable for digging into their specific needs.
Having previous successful experiences with the same client made it that much more effective and rewarding to engage ourselves in the joint work again. Guided by experience, at the very beginning of the project, we also prioritized the functionalities to identify those that would deliver the most value to end users.


The core of our work involved front-end development and UX-UI design. We performed a detailed target audience needs’ analysis backed with user research and tests. As in the case of our previous projects with the client, highly usable data viz constituted a fundamental element of the developed interface. To that end, we used Plotly.js to generate charts with statistics used by Engineers. Thanks to our customized approach and cost optimization efforts, we imitated Material-UI, adjusting it to our needs, which resulted in unique views based on best practices.
In the spirit of smoothly aligning our work to the existing backend, we used the Apollo GraphQL client for backend adjustments and caching. Thanks to utilizing React Hook Forms, we were able to enable game reporting to the sports league, while React Contexts facilitated storing global data. We also used query parameters to reflect the current state of the application in the URL, which proved handy in storing the filter settings and sorting the beginning and end of the selected scope of dates.
As far as Quality Assurance is concerned, after a critical analysis of the current needs and risks, we followed the MMP line of thinking — with an emphasis on quick ideas validation, delivery of the necessary functional scope, and implementation of changes based on end-user feedback. We performed manual system tests which showed if the system works well against the predefined requirements. Thanks to executing unit tests in the React Testing Library, we were able to determine if the specific units of code work as intended while covering 70% of the app.

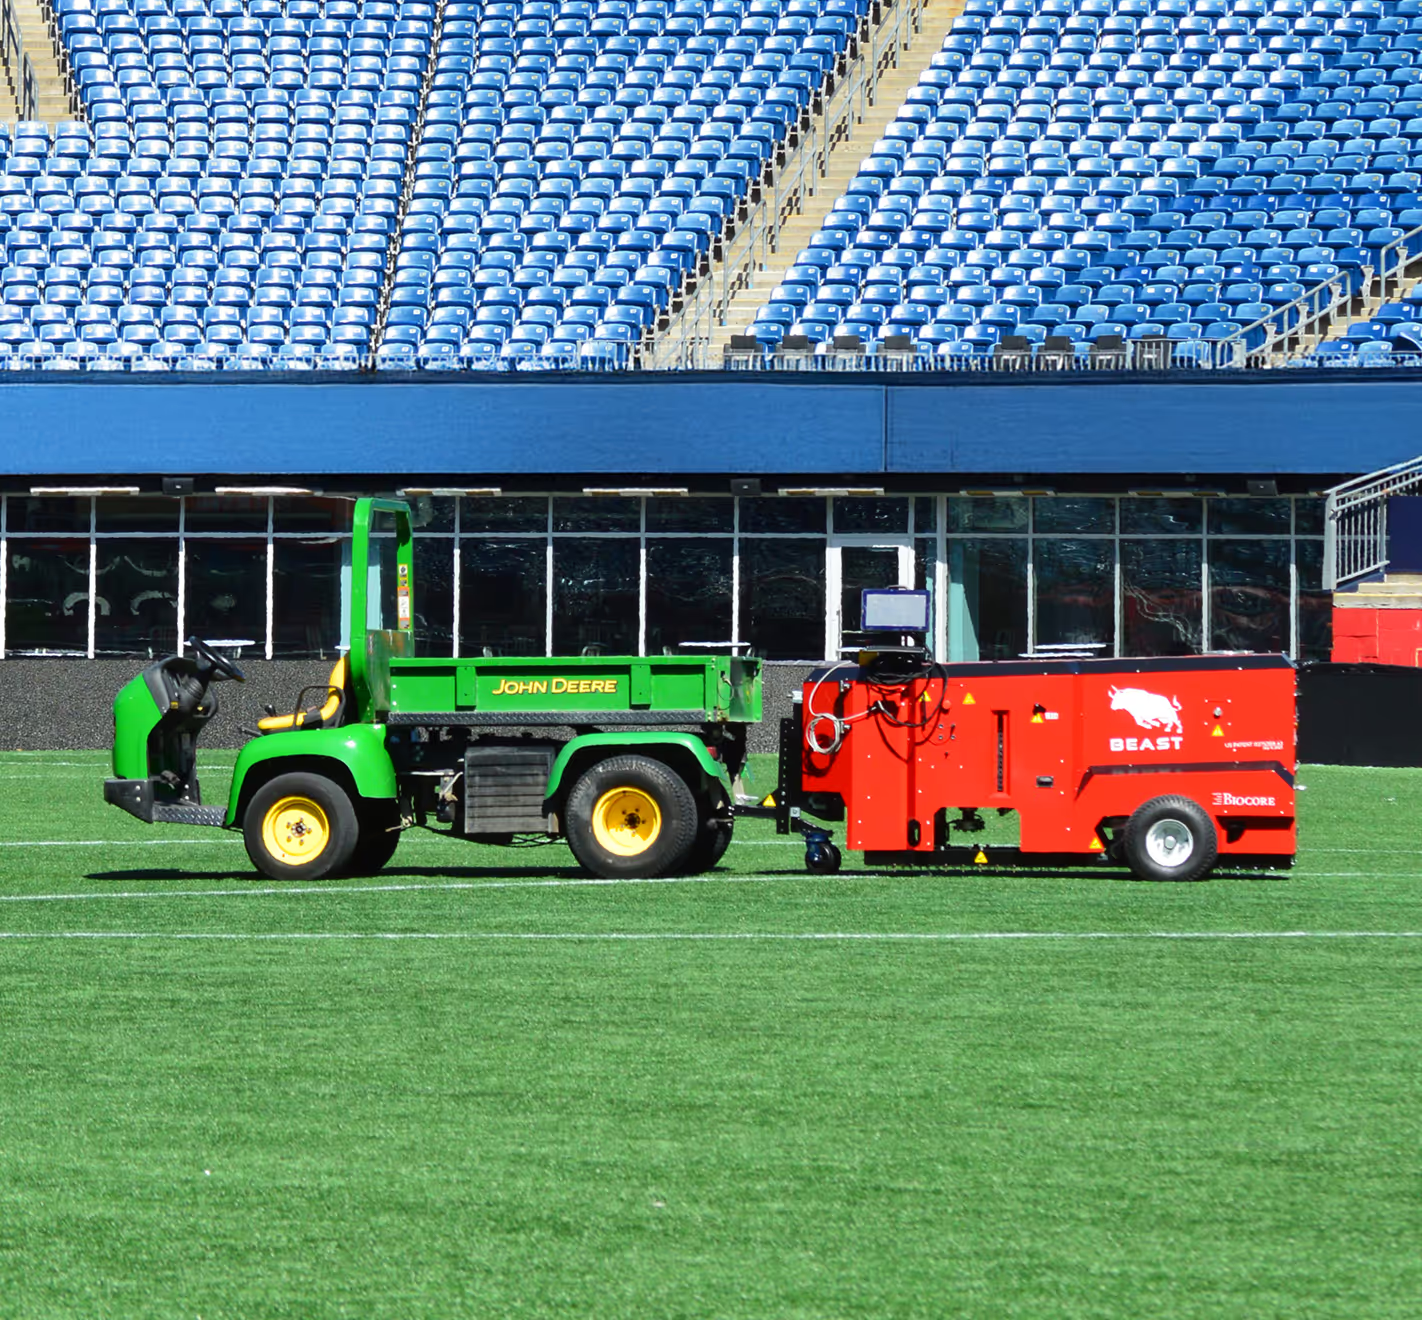
The client had clear goals as far as the product vision was concerned. For the project execution, we relied on the Kanban methodology and aligned the details of new features within iterations with the client team to maximize the final effect. Such a co-creation in the spirit of maturity, constant communication, and collaboration were crucial, especially for a discovery-type project executed remotely across different time zones. Our flexible approach during project execution allowed us to fully adjust our steps to the flow of parallel client-side processes - the BEAST machine was in the testing phase while we were designing a digital solution to accompany it. The end product solves its users’ real problems by optimizing their daily work. Our powerful data visualizations, including bar charts, candlestick charts, and line charts, facilitate drawing informed conclusions.
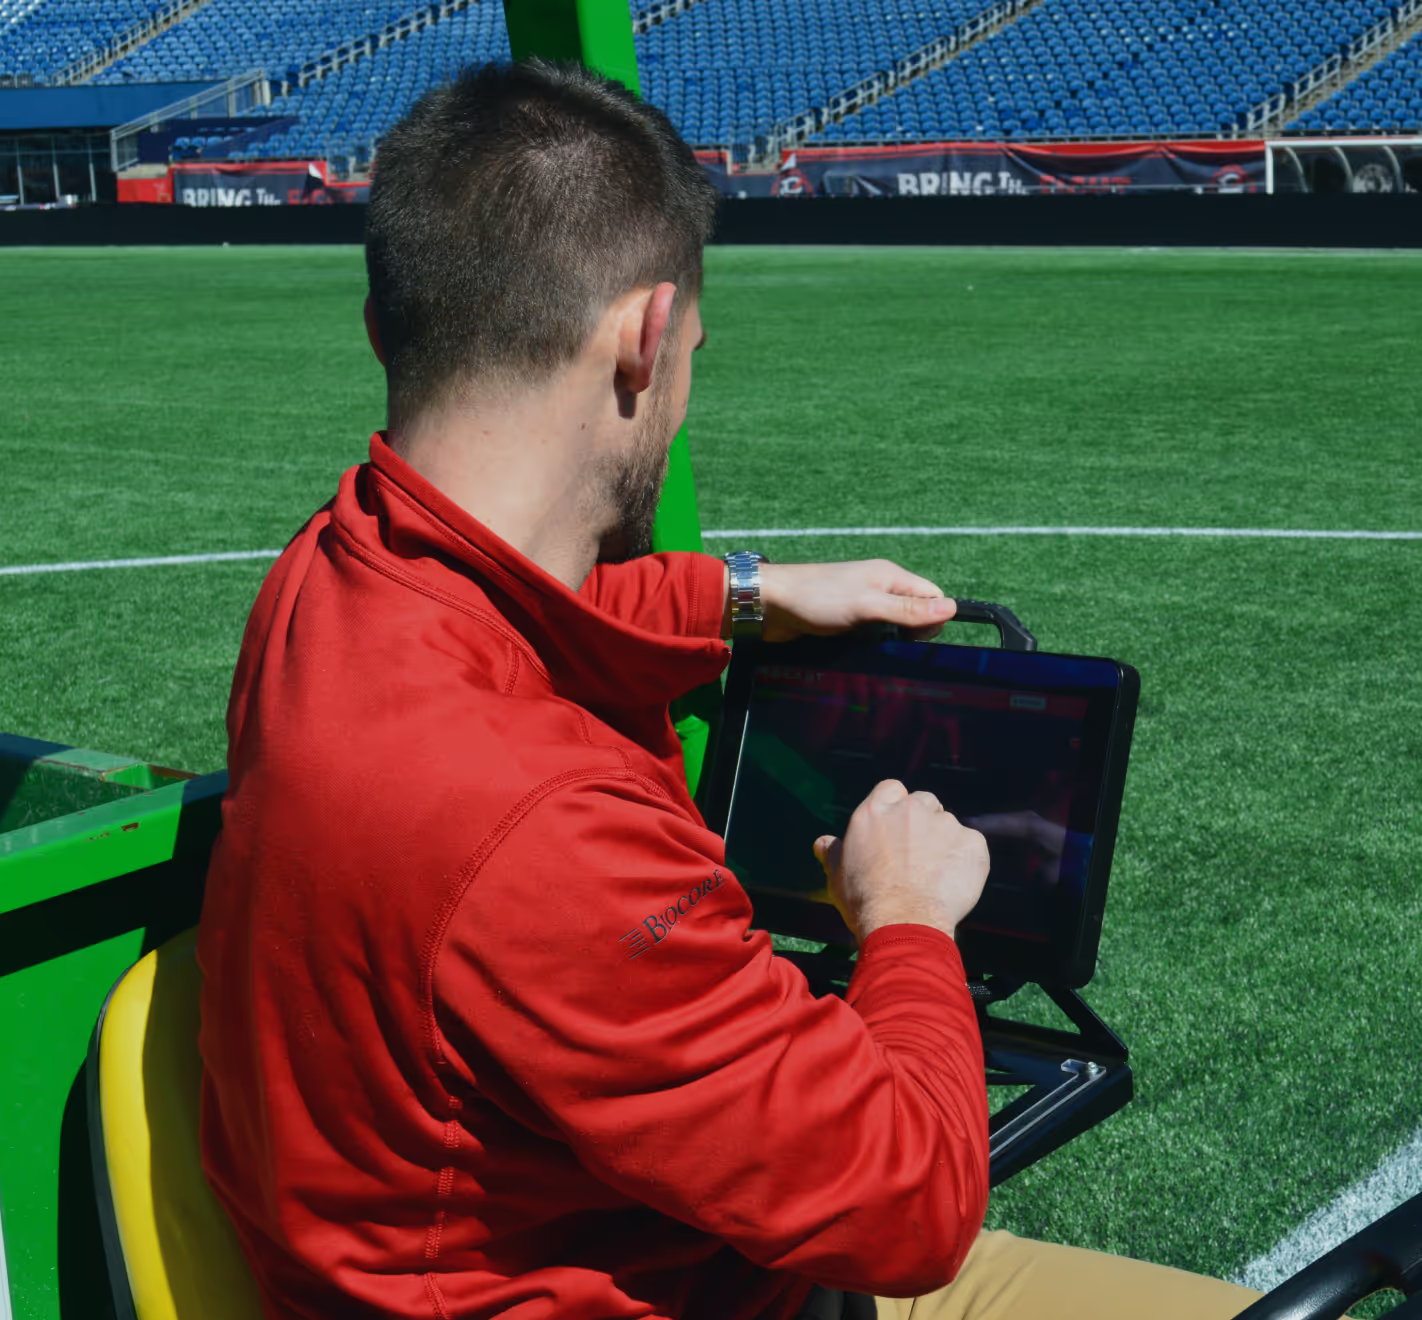
As one Field Manager noted:
Beyond aesthetics, the UI improves daily operations through several key technical milestones:
This digital transformation now offers comprehensive, long-term data on field conditions, maintenance, and surface changes. It provides a complete, data-driven overview of the entire professional American sports league ecosystem, ensuring safety and performance across every field in the league.


Users can add events to the calendar as well as edit them. This feature shows what is happening in each of the fields together with various summaries and statistics thereof. It also includes monthly and weekly views for users’ convenience. The calendar functionality automatically downloads the planned field activities by means of the GraphQL API.
The feature shows the Field Managers how the state of the sports field changed over time. The ability to interpret both current and historical data speeds up data analysis processes.
The functionalities inform the Field Managers about the state of the field surface for its many defining characteristics like impact hardness or infill depth.
Field managers can report on the fields’ state to the sports league. The reporting module allows these users to use BEAST test results and added calendar events to streamline the processes taking place between Field Managers and the league.
.svg)
.svg)
.avif)

.avif)
.avif)
.avif)
.svg)


.svg)